Data analysis project using R:
Worldwide malaria infections and mortality

I used World Health Organization datasets to analize the malaria desease infection distribution and mortality rates using R
I imported, cleaned up and visualized the data using packages from tidyverse (ggplot2 and others), rlang, janitor, cowplot and ggbreak. For example, the code to visualize connection between country's GDP, population and malaria mortality rate:
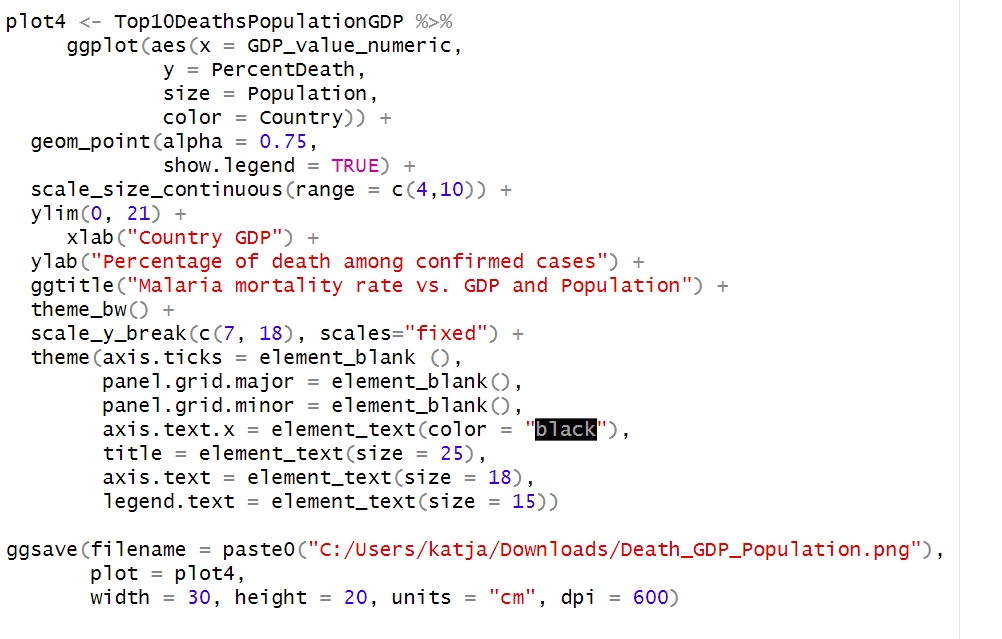
The full R code can be viewed